Using Graphics in Business Writing

As a business professional, writing business reports and documents are just part of the job. Writing an informative and persuasive document is hard work. There are times when words alone cannot convey the message. It takes some help from good use of graphics.
Proper use of graphics in business writing can help visual learners, elaborate ideas, and provide meanings to data.
Graphics Help Visual Learners
A picture worth a thousand words. It’s a cliché, but it’s true nonetheless.
Pictures, colors, and maps help visual learners to grasp a concept. It is said that visual learners retain 75% of what they see or read. This is an especially important take-home point when you are preparing documents explaining a new method, concept, process, or procedures.
Considering that 65% of the population are visual learners, adding visual aids to your business writing is just common sense.
Graphics Elaborate Ideas
Graphics make abstract concepts concrete. Numerical and logical relationships are better described with graphics too. For instance, when describing a step-by-step process, graphics are by far more effective than walls of text. Visual learners will have an easier time grasping the flow and details of the concept. This can help them understand the complete process in a short amount of time.
Graphics Provide Context To Data
Let’s say you’re working for a telecommunication company who’s trying to spread its wings to new markets. You’re preparing a business report depicting potential market based on the number of internet users as the percentage of a country’s population.
Your research shows that the company will get the best result when aiming for countries with 20-29% internet penetration. What kind of graphics should you use?
Well, the following map is a good example.
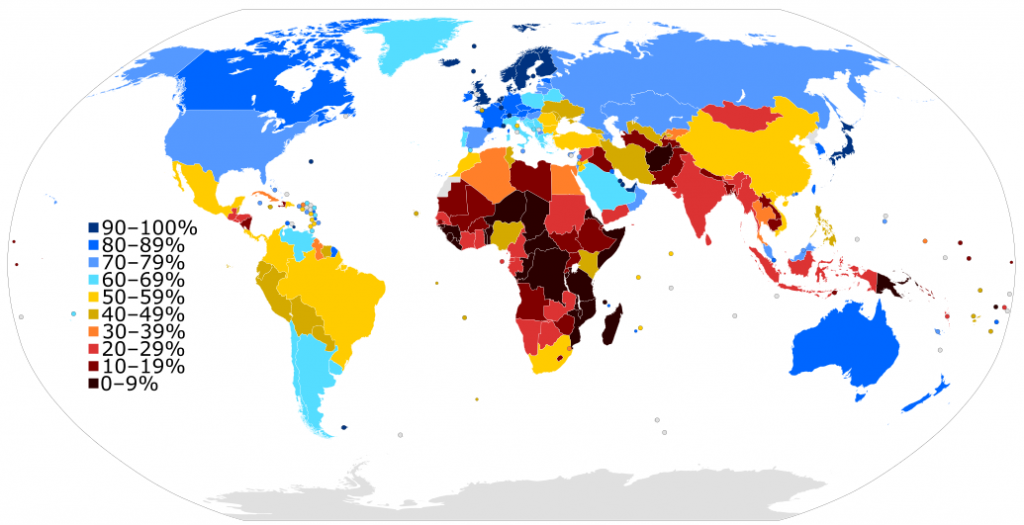
See, it’s easy to see which market that’s off limit from the map.
All said, you should not put the importance of text aside. Functional graphics accompanied by descriptive and clear writing will improve the effectiveness of your business writing. And please, make sure your writing is free from grammatical and spelling errors.
Be sure to refer to the graphics in the text and make their meanings clear to your audience. Moreover, the graphics should not duplication the information found in the text. Redundancy is not a good thing.
Think of your audience. What kind of graphics will enable them to understand the document better. Will the graphics make your ideas and information layout clearer?
Also remember to keep things simple. If you have a wide selection of drawings, diagrams, charts, tables, and graphs to use, you need to select the best possible type.
Let’s say you need to lay out the company’s quarterly revenue for last year. A simple column chart is an excellent tool for this purpose. It allows people to see how well the company did in a quick glance. No fancy stuff is needed.
Drawings in business writing is a big help, but don’t overdo it.